


Admin Users
Robust Data Tools to Improve Connections and Show Success
Over the past few months, we’ve worked with our partners to dramatically improve the analytics portion of the PeopleGrove platform. […]
Admin Users
Over the past few months, we’ve worked with our partners to dramatically improve the analytics portion of the PeopleGrove platform. […]
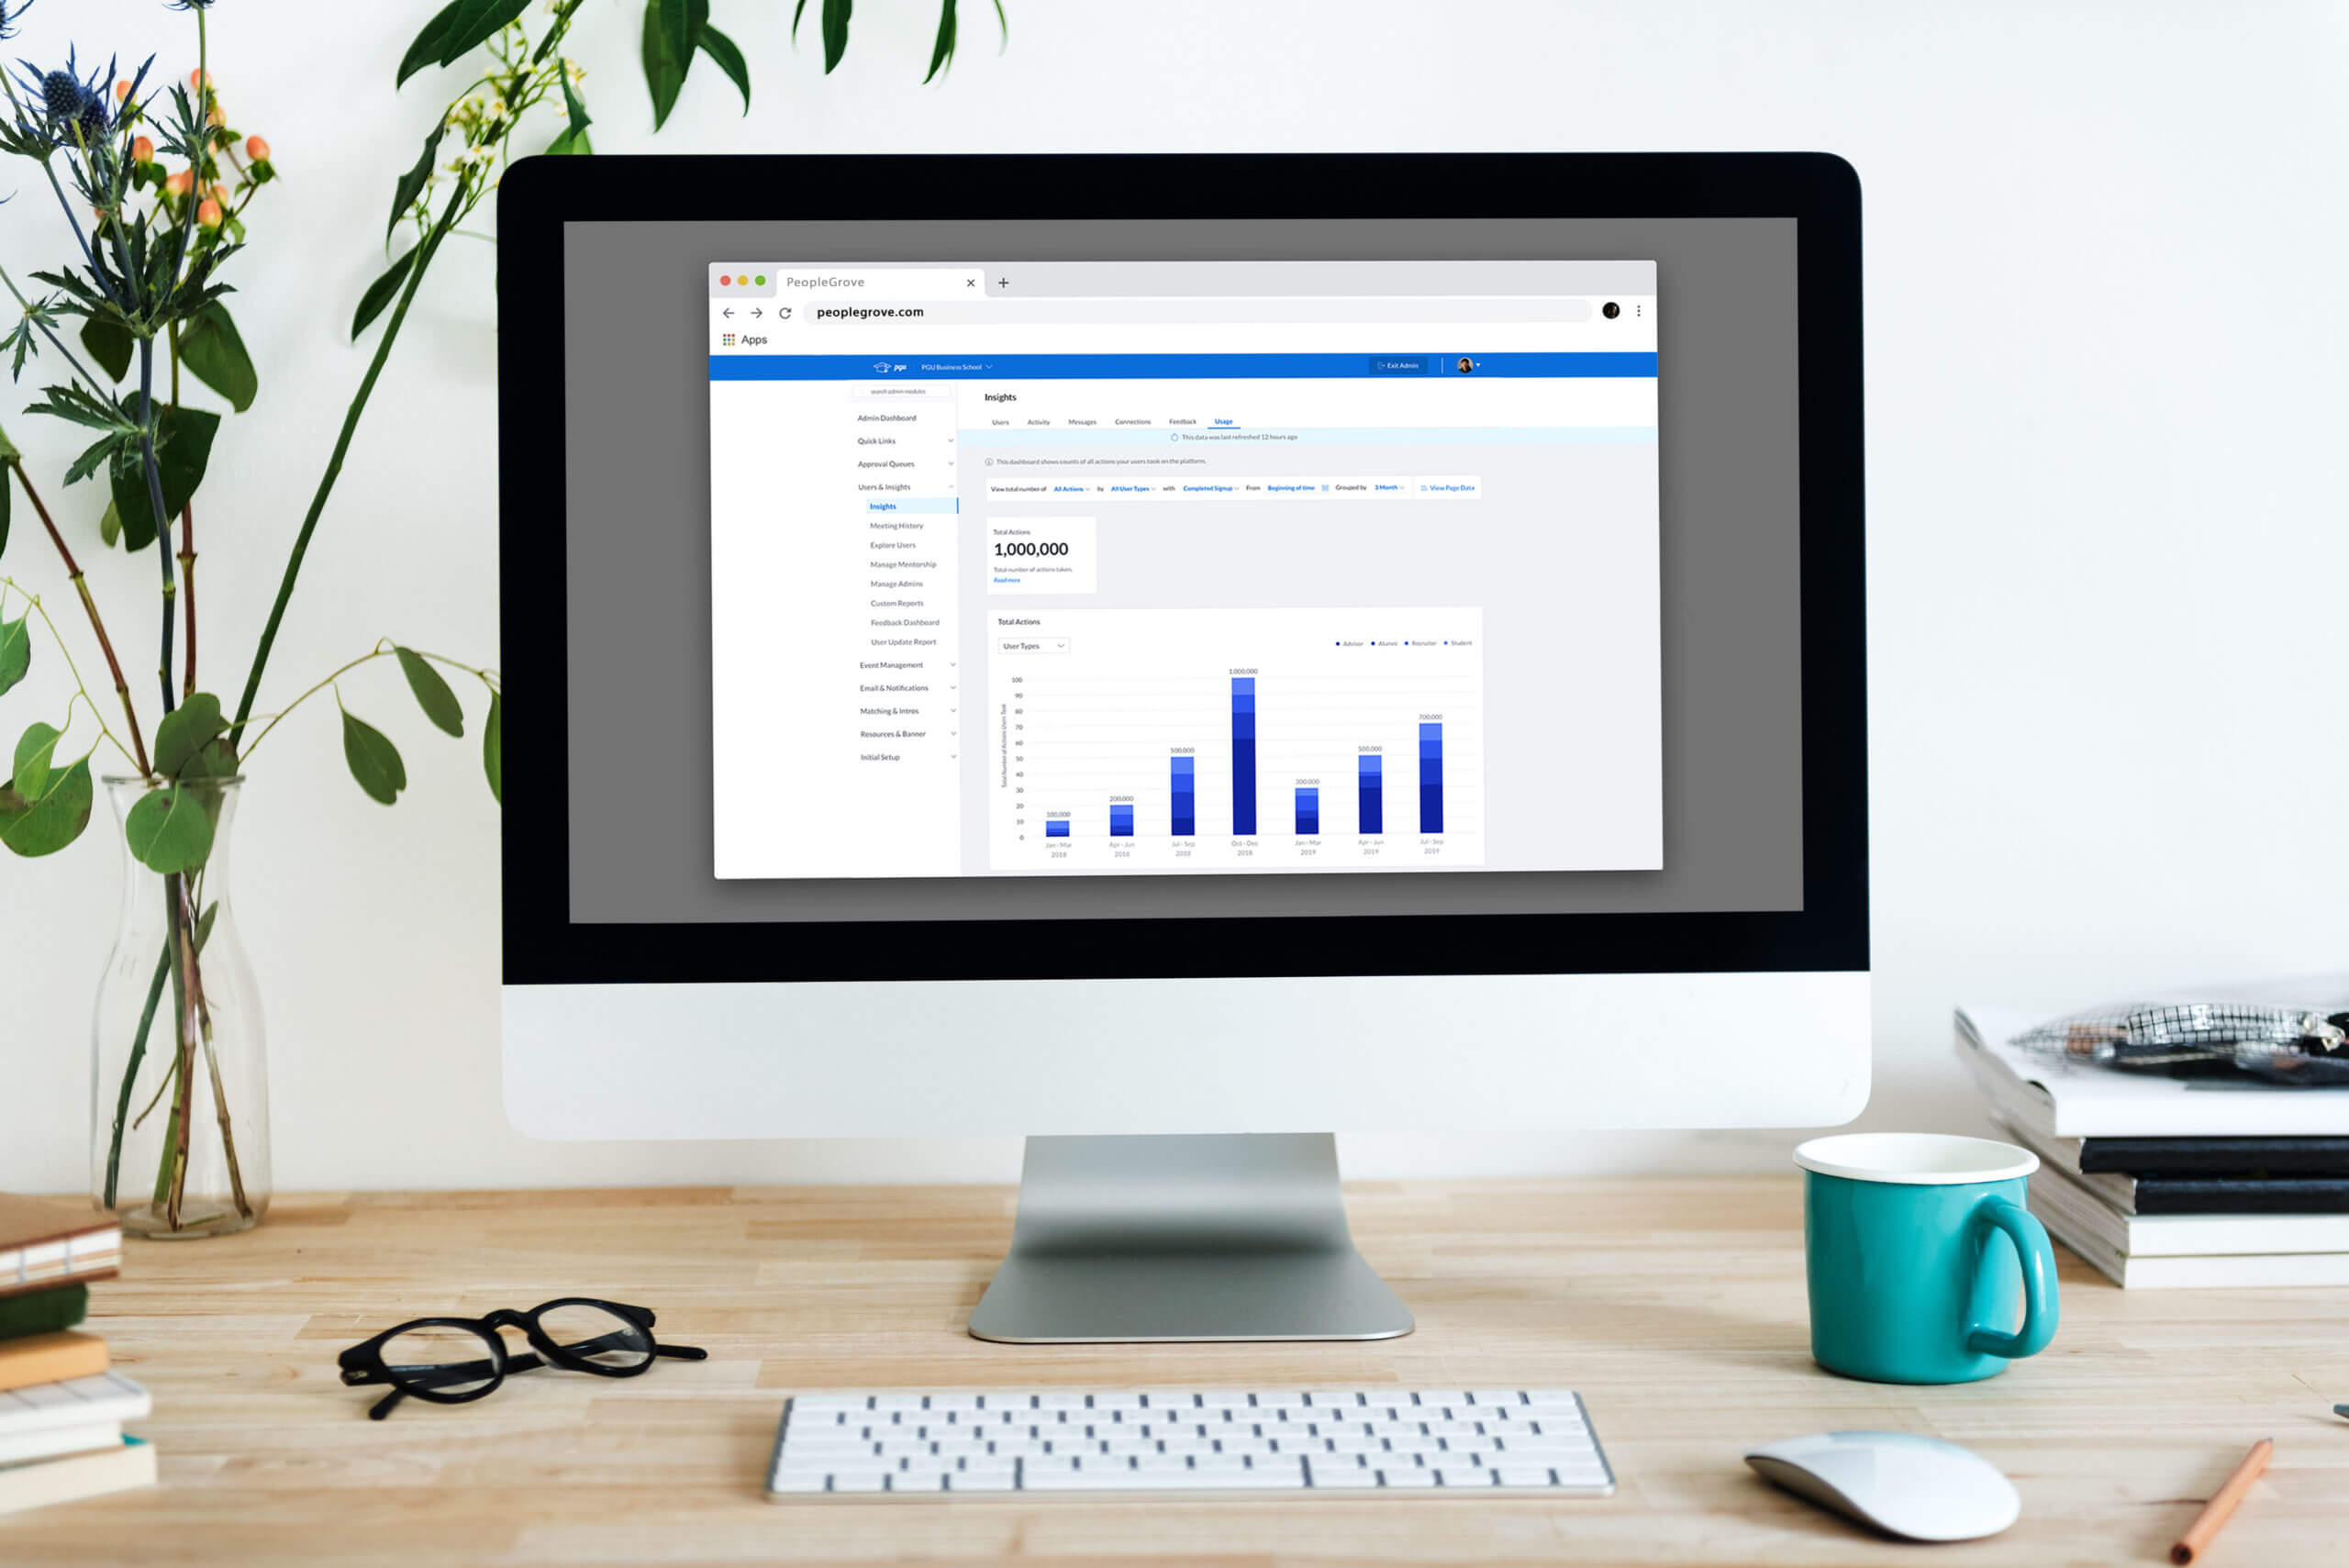
Over the past few months, we’ve worked with our partners to dramatically improve the analytics portion of the PeopleGrove platform. We know you don’t have time to dig through virtual stacks of data, yet you need a clear way to view and share progress with your institution’s constituents.
That’s why we’re excited to release robust, yet elegantly simple Data Tools that makes all your data easy to view, understand, and share. Here are four main features of the new Data Tools:
1. Get more clarity
We want to help you focus on the metrics that matter most. Now, you’ll be able to track the number and location of your users, measure how many connections have been made among advisors, alumni, and students, and see what type of messages have been sent as well as the rate of response. You can view recent months or see progress made from the launch of your platform. With this bird’s eye view, you will now note clear trends in student engagement and alumni connections.
2. Dive deeper into specifics
Larger trends can be very useful, but sometimes you need to drill down to specific individuals. We’ll be providing you a deeper dive into data such as your users’ educational and work history records. You will be able to view who works where, in what industry, and their role.
3. Screenshot ready
All the charts are now represented with such visual clarity that you’ll be able to easily grab screenshots of selected data and include them in your reports, quickly and painlessly demonstrating the success of your program.4. Useful new data
We’ve collected interesting new data that will provide additional insight into how your users use the platform. You can look up the rate of connections across your users, the percentage of users who took the next steps in connecting, as well as which users were bookmarked by other users.
We also added a handy new Glossary to help you understand all the terms used throughout Data Tools. If you are ever confused about the difference between an Advising Connection and a Flash Connection, the Glossary is on hand to remind you what’s what.
What you can do with your data
Keeping track of data and analyzing it for trends will help you adjust your outreach strategy, see where most attention is needed, and improve the effectiveness of your growth efforts. The new Data Tools is a quick way to see and share the value your program brings to your institution.
We look forward to seeing what additional ways our partners come up with to use the new Data Tools.

Career Services
For nontraditional students pursuing higher education while balancing work, family, or both, support can be key to student success. University […]
4 min read

Alumni & Advancement
In 2022, PeopleGrove released the first-of-its-kind impact report. Its goal was to understand how student-alumni engagement communities – which PeopleGrove […]
4 min read

Career Services
How Science and Deep Insight are Shaping the Future of Career Services The Promise of Informed Choices Imagine knowing […]
3 min read